
Fractal Art Gallery
Blowup Parameter Study
|
|
Fractal Art Gallery Blowup Parameter Study |
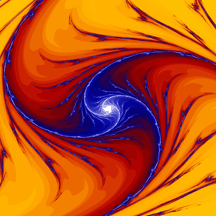
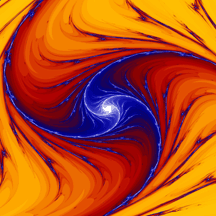
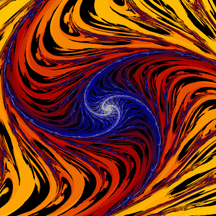
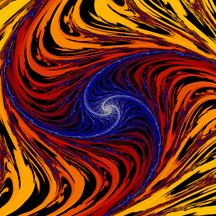
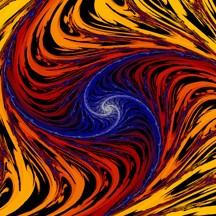
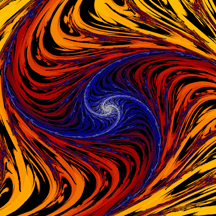
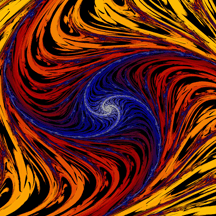
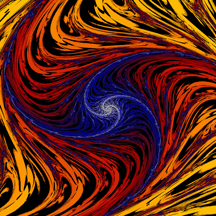
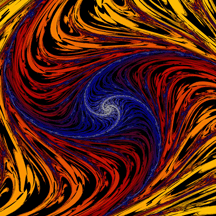
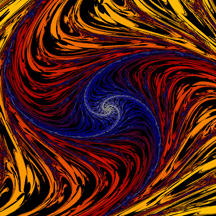
These 16 images represent what happens when the "blowup" parameter "P" is
adjusted from 1 to 2 to 3, up to 640...notice how the black areas of stability change.
Areas that graph black are areas that never exceed that parameter, i.e.,
areas of great stability...look at the subtle changes in the series...I think I will expand
what happens between P=2 and P=3 for next time.
 |
 |
 |
P
= 1 |
P
= 2 |
P
= 3 |
 |
 |
 |
P
= 4 |
P
= 5 |
P
= 6 |
 |
 |
 |
P
= 7 |
P
= 8 |
P
= 9 |
 |
 |
 |
P
= 10 |
P
= 20 |
P
= 40 |
 |
 |
 |
| P = 80 | P = 160 | P = 320 |
 |
||
| P = 640 | ||